It has been a heady few weeks. Slow but steady progress on a book amuses myself and my editor, thankfully. I finally can relate to authors claiming to not know what their characters will do until they write them onto the page. Perhaps this one becomes demure when captured by the charms of a suitor while another tosses her head back in a throaty laugh and blushes with wine and charisma.
Except my book is about geospatial analytics. The leading lady is a sinewy Python intoxicating her devotees with unwieldy data sets and coordinate systems. Perhaps the most mysterious character is a location on the earth’s surface reluctant to reveal the “why” and “how” of hidden histories.
Social justice seems to be a recent cacophony of voices while simultaneously echoing over 400 years of whispered histories. I “walk” the hallways of Clubhouse moderating topics on geospatial analytics, poverty, and diversity. I believe everyone should have a voice for holding conversations but not if looking back at documented atrocities and shameful behaviors is frowned upon.
We were a young nation. Discrimination and devastation was rampant. Blacks were 3/5ths a person and then subsequently labeled as African Americans solely to identify the colonizers. Did we ask ourselves how we progressed from a new nation to economic superpower in record time? Are we listening to the response? Free labor.
The history of police brutality is an honest story of origin. Not an ideology or political argument. The police force was created for the sole purpose of returning escaped slaves. Maybe if we acknowledge our troubled past we can create a better version of who we have become? Not defund police departments but reimagine. Public safety is a large bucket and none of it means shooting people dead in the streets or choking them live on camera.
When we map our history we see patterns hidden in single dimensional spreadsheets. I listen so I can learn. Learn to formulate better data questions. Learn to find the right data to address the gaps.
Here is where curiosity may lead you…
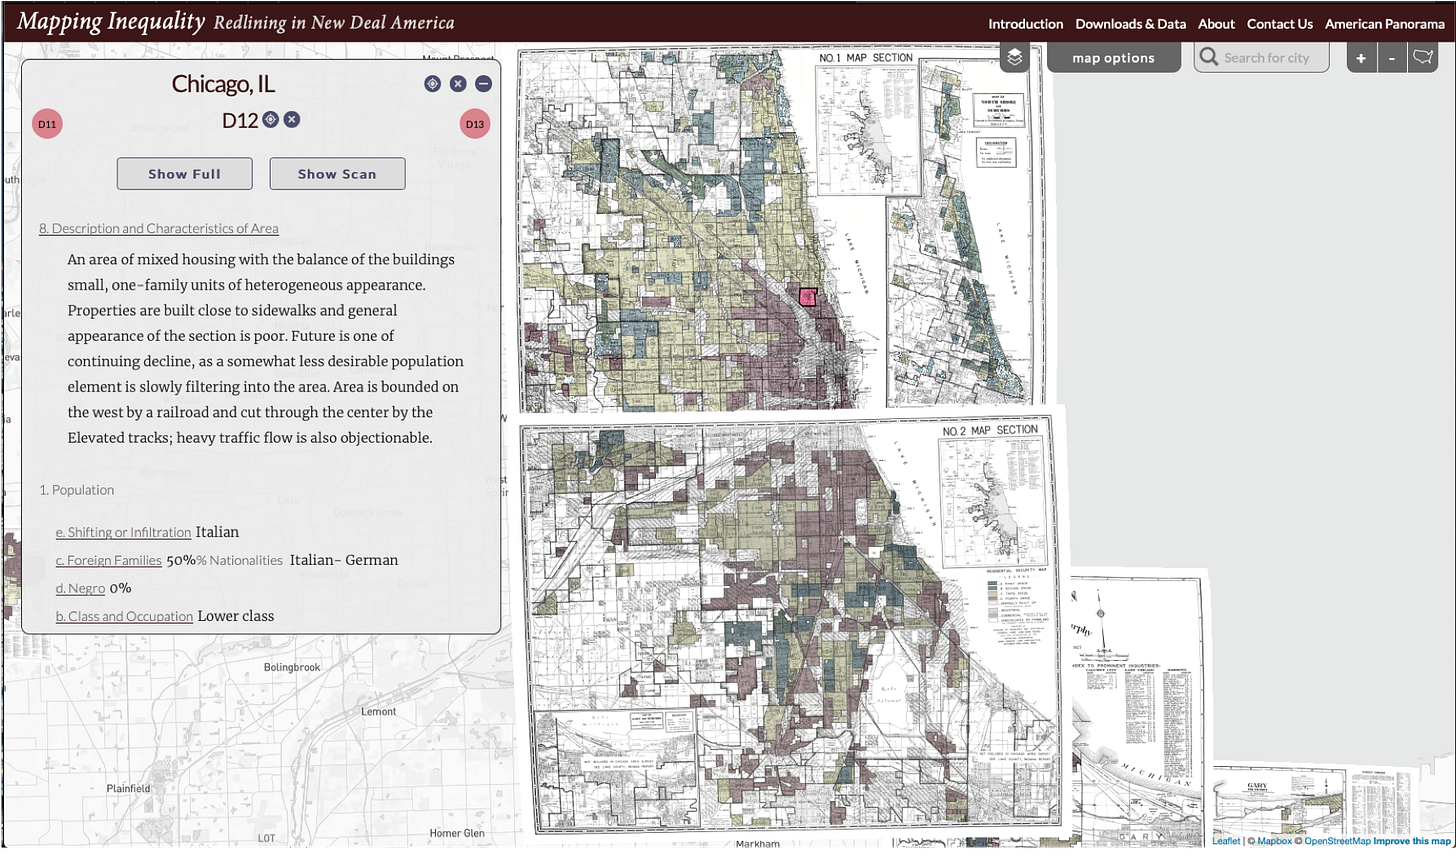
Mapping Inequality Redlining in New Deal America I wrote more about the data resources below on my blog, Data Talks, People Mumble. You are able to search for your city and look at historical redlining from the 1930s and evaluate how land-use may have locked in generations of instability and inequality.
How does climate change impact neighborhoods that historically have lacked economic development, have fewer green spaces, and less walkable neighborhoods?
ArcGIS Urban Heat Islands — South Shore Chicago, Illinois
These are simply seeds of ideas. We are able to access a growing volume of open-source data. A lot of this data has a geographic identity—a set of coordinates, a zip-code, address, or a satellite image for example. Geography is the foundational element that can bring together multiple industries and consider a common framework for answering questions we didn’t even know we had.
Our world is evolving without consideration, and the result is a loss of biodiversity, energy issues, congestion in cities. But geography, if used correctly, can be used to redesign sustainable and more livable cities.—Jack Dangermond, founder of ESRI


