I am building a few courses for a large tech & business training company. Along the way I have found a few accessible nuggets that might be useful in your workflow. These small little nudges can lead to a thriving data center in your organization or perhaps we scale it down to the level of your desk.
New skills | New opportunities
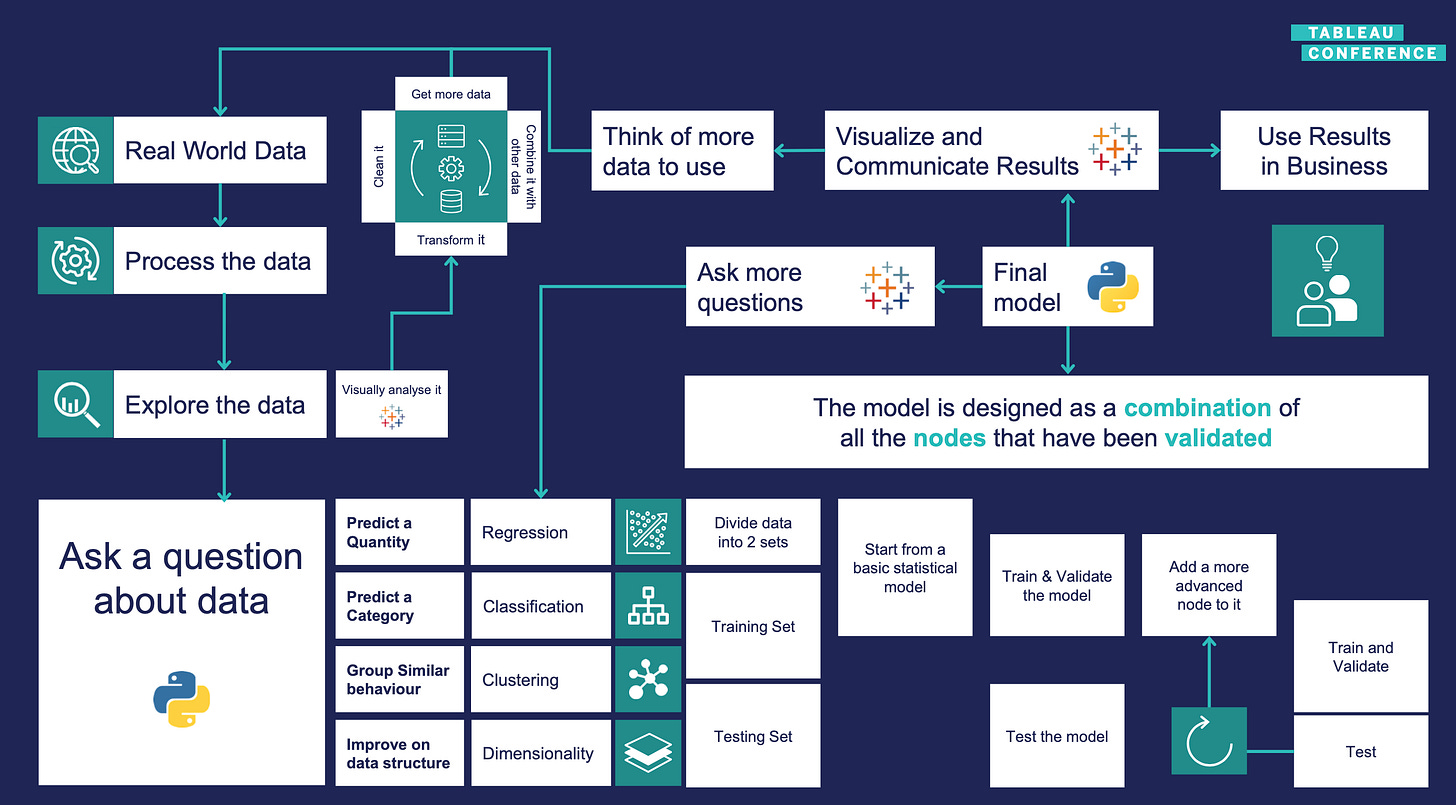
This graphic from Tableau Conference 2019 says it all:

But often “all” can be quite a cacophony. I completed an executive online class from Fu Foundation School of Engineering and Applied Science from Columbia University in Applied Analytics. Whew. But here is the rub. Once you hand in all of the projects, complete assignments and quizzes, and complete your Capstone project—now what?
We are going to break these steps into small bites. Like eating an elephant. One bite at a time. It’s simply a saying. I would never eat an elephant. I am a vegetarian—but you get the metaphor.
I had lived and breathed Python for months but it was sort of like bowling with the gutter guards engaged.
Without them I was simply sending the ball down the lane hoping for the best lol.
We will start here:

We need to find the data. Free subscribers will get the summaries. If you would like the opportunity to explore the step-by-step guide with a deeper dive—go for the paid subscription. I priced the yearly rate to cost less than a single webinar but it will be packed with the details you will need to follow along with your own data.
Any remaining questions will be addressed in scheduled Q&O sessions. I stole the Q&O from a colleague that says she doesn’t always have answers but can often offer an opinion. It sounds more collaborative to me and less didactic.
Where can we find the data? Here are a few examples we will explore.

Before we think about visualizing our data—we need to formulate a data question. My biggest beef about many of the online classes about data visualization is the quick rush to create graphics.
What are we looking at if we aren’t informed by a well formulated question.
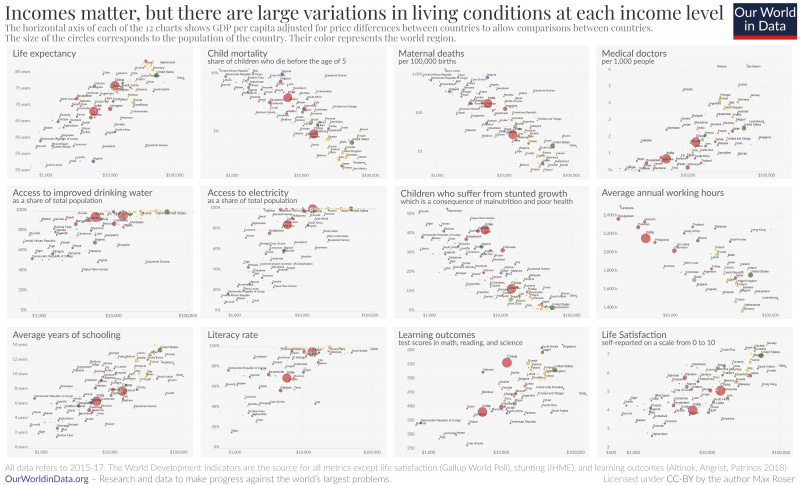
Our World in Data is a treasure trove for you to explore. Next week I will link to a video as a guide in how we begin with a question. I suggest exploring and seeing if you can identify a data source of interest. It will be handy to have something that interests you to generate questions and guide you through the process.

Thanks for subscribing!


