Is it possible that you missed this great Jon Adams’ cartoon? When I named my blog data & donuts it had a literal and a figurative meaning. When the Internal Medicine Fellows were presenting their data I used donuts to get butts in the seats. Standing out in the hall, beckoning busy physicians in training, “Come for the donuts, stay for the data” would usually serve the purpose.
Now I think of donuts as the little insights that might make your job a little easier or interesting.
The Flerlage twins recently published information on how to prepare Census Data for visualization in Tableau. If you read their blog regularly—and why wouldn’t you?—you might be familiar with Sarah Battersby from Tableau.
She is a brilliant cartographer and I have learned quite a bit from her insights around working with Census Data. I don’t use a Windows environment though and I thought perhaps some of you don’t either so I am including a few things to help you recreate her insights in a MacOs world.
I am basically doing the same thing using her code with a few exceptions. I updated the link to current data and I prefer using Jupyter notebooks in Colab. I teach a lot of programming and find it easier to share Python code using a browser—not having to configure a bunch of stuff. There are limitations but if you are new to Python you shouldn’t bump into many of them.
Here are the steps outlined by Sarah:
Start here with a jupyter notebook: Harvesting Census Data (for use in Tableau…and anywhere else)
Once you can get your code to run, then you are ready for the latest blog post:
The Power of Place: Unleashing Census Data in Your Tableau Analytics with Tableau Zen Masters Kevin & Ken Flerlage.
The code below was simply from following along with the jupyter notebook (link above)—easy peasy.
Also when you save the file to pull into Tableau, the code you would write is:
df.to_csv(r”/content/my_census_data.csv”)
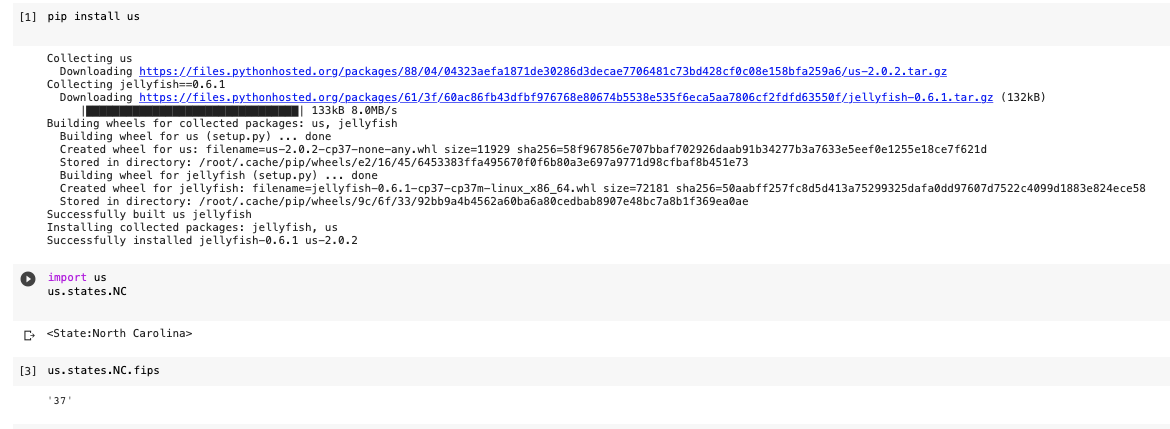
I also use a package that helps with the FIPs code iteration and results in a nice clean list that you can paste into Tableau Prep for example to join the codes with the actual column heading and labels you will be using or in Python you can just list them in the quotes and they will replace the codes with easier text,
column_names = ['', '']df.columns = column_namespip install usimport usus.states.NCus.states.NC.fipsThe steps for using the Census FTP Site are a little different with MacOs as well but just as simple. The directories you are interested in can be mapped to a network for you to download to your local computer.
American Community Survey directories are located on the FTP server at https://www2.census.gov/programs-surveys/acs/. If you are using a FTP client, the server address is ftp://ftp2.census.gov. You do NOT need a user name and password. If prompted for one, use "anonymous" as the user name, and no password.
If you got to Finder >> Go>> Connect to Server
Insert the server address and now you can access the folders and save them to your computer. They are listed by their state FIPS code but for simplicity I only downloaded my state—North Carolina.
Now you can spatially join the csv with your geography file as described by Sarah below:
I only wrestled with the North Carolina data for simplicity and time but with a bit of easy joins in Tableau Prep or Python to change from FIPS codes to more insightful column headings and labels you are ready to go.
A fun exercise I encourage for folks ready to ask location questions of their data is a Towards Data Science article, Mapping US Census Data with Python by Jackson Gilkey.
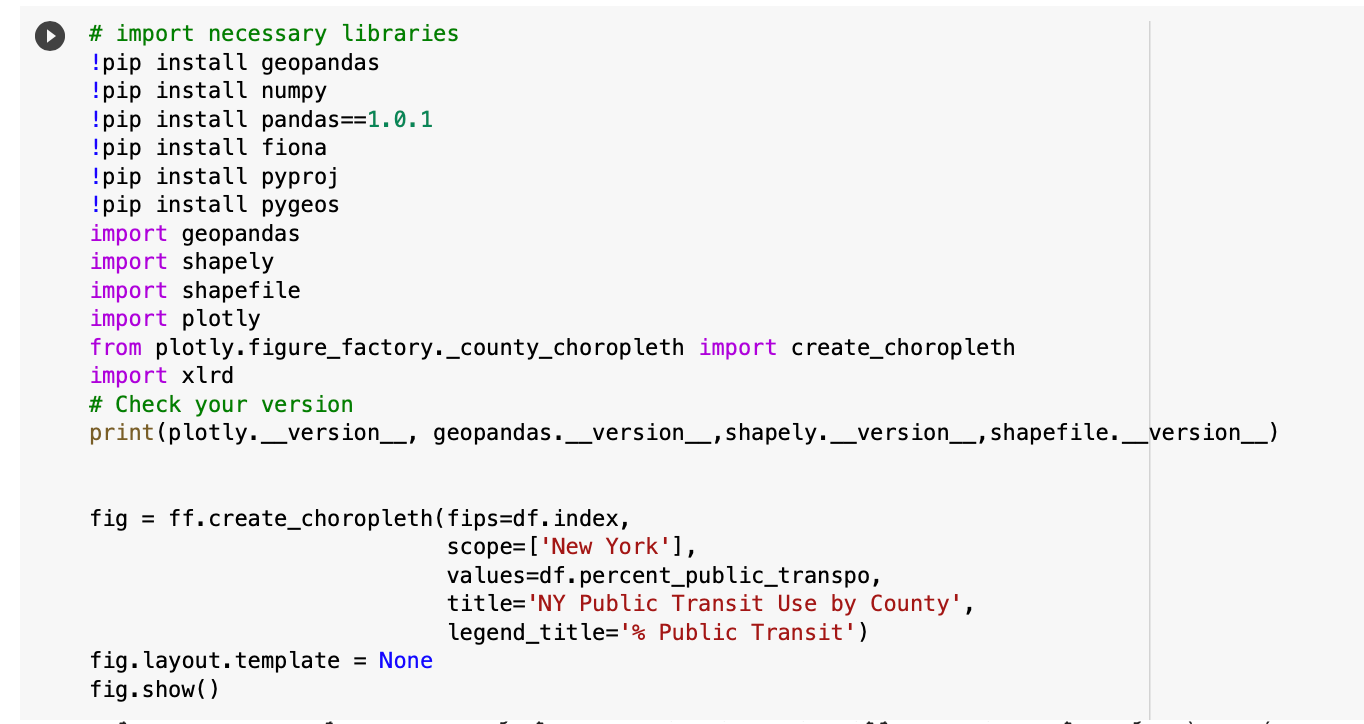
You can swap out tables that answer your data question. Here is my code for reference but try to step through it and see how you do.
Here is a list of Public Transit Use by County but depending on your data question you can access the Census Tables and reference them, perform calculations, and rename or add new columns all with Python. Then you can visualize within Python or save as a csv file and import into Tableau.
If you have questions please reach out on twitter or leave a comment (subscribers only are able to comment here).


