(data)literacy could be the ladder out of poverty--Morgan Freeman
"If I had an hour to solve a problem and my life depended on the solution, I would use the first 55 minutes determining the proper question to ask, for once I know the proper question, I could solve the problem in less than five minutes."
--Albert Einstein (1879-1955)
Data literacy is a popular buzz word lately. Often cited as an organizational goal or an individual professional metric but you might be surprised how blurry the end game might be. How do you define success? When are you considered “literate”? And why are courses delivered in soothing dulcimer tones? Where are the challenges and limits? The solutions are not marketable and should be evolving with the complexity of our data questions.
Morgan Freeman wasn’t necessarily referring to data in the opening quote (in the title) but you can see why I made the leap. Better data, better questions, better insights. We need to curate empathy not the next gizmo for sale.
In my opinion, this is mission critical. You can design, sell, even give-away the alleged “secret sauce” but make no mistake--this is more than what chart to use to display your data or how best to create a visualization.
The decisions you make upstream to tool selection are more important than the tool itself. We don’t have the luxury of mistaking an ideology for an effective solution to complex problems. Tableau is trying to make introductions to data literacy that albeit a little late to the party--might help guide us all in the right direction.
My main criticism is that all roads to literacy appear to be paved with Tableau products but having said that--Tableau Public is free and can certainly launch you on a journey of data discovery. When I teach data literacy--especially since my audience is typically underserved populations or adult learners--I share free resources along with the paid alternatives.
Because if literacy is not equitable, what is the point?
CENSUS data
Data literacy requires actionable insights and workflows. Although many of us work with large datasets (especially in healthcare) I spend much of my time in Census data files.
Here are the buckets from the Tableau data literacy initiative. The next few posts will explore how these apply to an actual data set.
Introduction to data literacy
Recognizing well-structured data
Exploring variables and field types
Exploring aggregation and granularity
Understanding distributions
Understanding variation for wise comparisons
Using correlation and regression to examine relationships
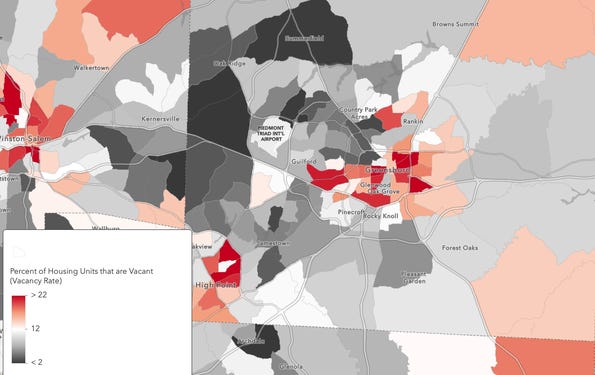
For example, when I want to examine poverty or racial inequity I know there is a variable in the Census data that will look at vacancy rates. This is exploratory data analysis but I need to find the data.
I skipped ahead simply to show you how I might do a little front end research to figure out where I might begin to find meaningful variables. I remember a project in Los Angeles where there was an association made between poverty, race/ethnicity, and percentage of multiple family units.
This data is also captured by Federal Government and economic forecasters to gauge the economic environment.
When working with Census data you need to know which tables contain the data you hope to explore. I know that B25004 has the data. I have spent more time with the 2018 data but we do have access to 2019 although with limited geographical files so I rely on acs5 for 5-year data in real life but for purposes of this quick look here is what I am sharing.
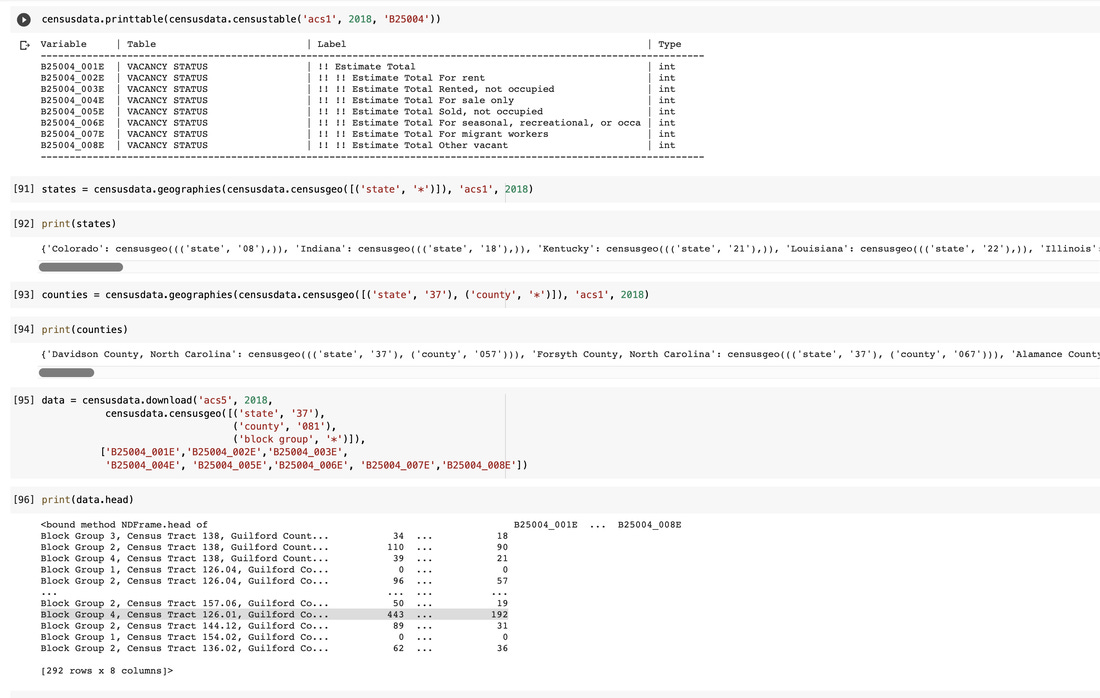
Briefly, I share how to find the codes for your state or county level data and how you bring the data into Colab for a rapid Python analysis. From my less than 10 minute query above I know that I might be interested in Block group 4, census tract 126.01 to explore vacancy rates and other attributes in the area.
A quick look in ArcGIS allows me to explore poverty levels in my local county to see if there are any trends. We notice that purple is displaying higher percentages of the population whose income in the past 12 months is below the poverty level. The next step for me would be to redefine poverty as the definitions we work with in government settings were articulated in 1963 and include income and only food expenses. It is out of date but we are able to define a wide variety of other variables better suited to identify contributions to inequity.
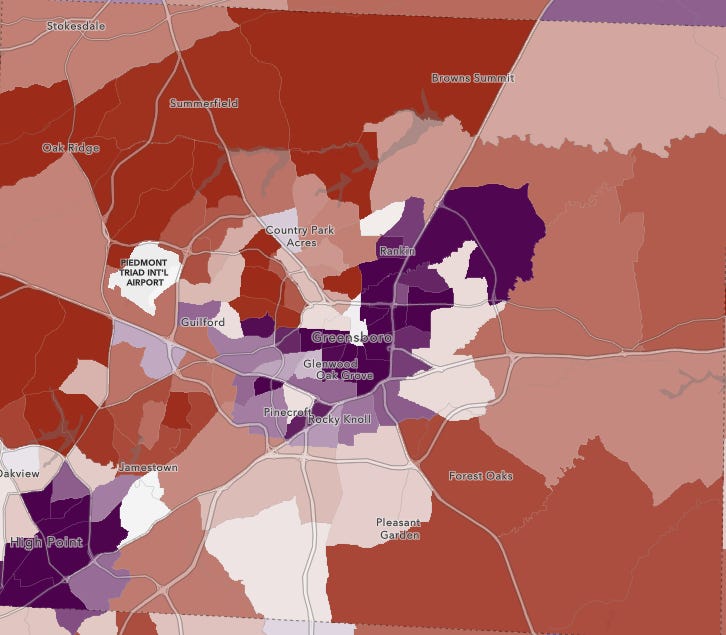
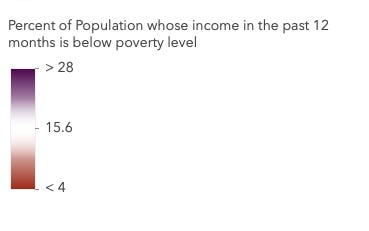
Think about overlaying the visualization below and see if you see patterns between vacancy rates in communities and where the poverty levels are highest. The dataset I normally work with has 62 variables all culled from census data. More to come...
Subscribe below for more insights...

Click below to see a story map created in ArcGIS...
